The product line
Every product runs on the same living ledger.
What it costs to earn $100 of revenue, measured from aggregate Uplinq small-business accounting data.
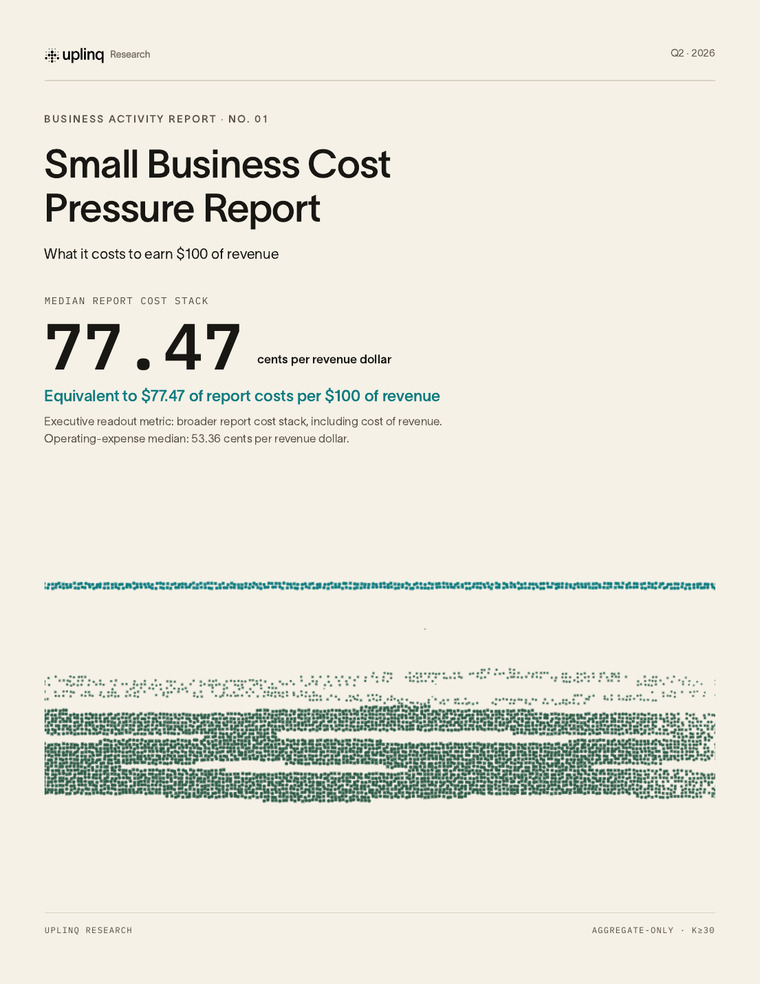
The median eligible company-month carried a 77.47-cent report cost stack for each revenue dollar, equivalent to $77.47 of report costs per $100 of revenue.
Operating expenses alone reached a 53.36-cent median share, before owner draw and other report cost layers are added.
Sticky cost-load categories created the largest median group share, with semi-sticky costs adding another 10.21%.
Auto & Vehicle, Insurance, and Payroll & Benefits showed positive growth gaps versus matched-panel revenue.
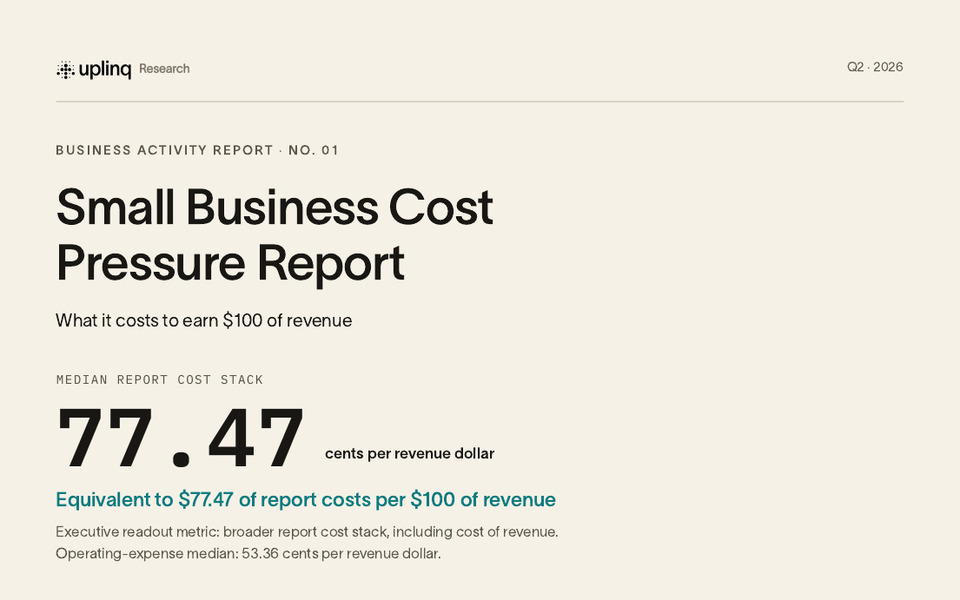
The published cover and headline cost-stack readout.
P. 01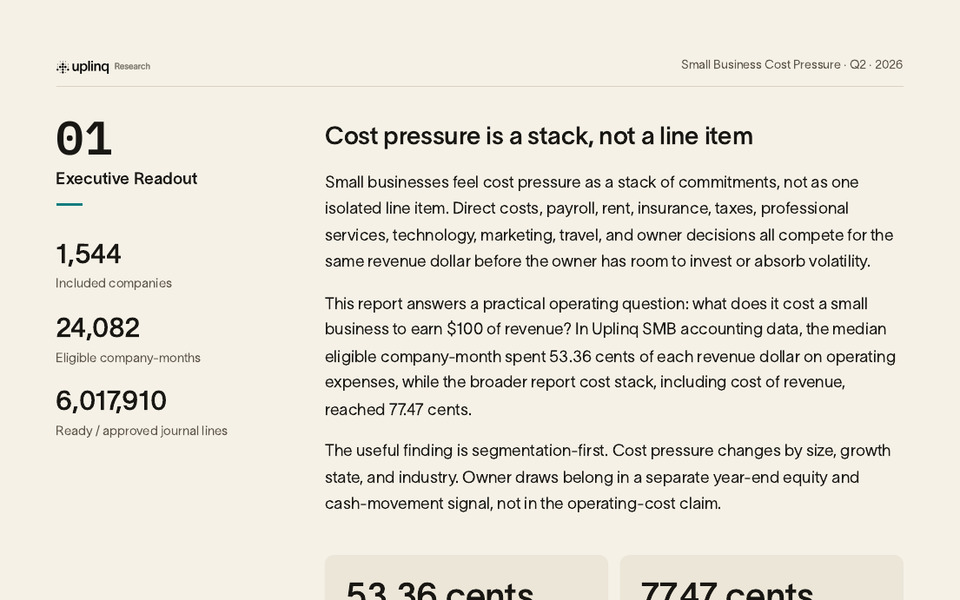
The included population and four headline benchmark metrics.
P. 03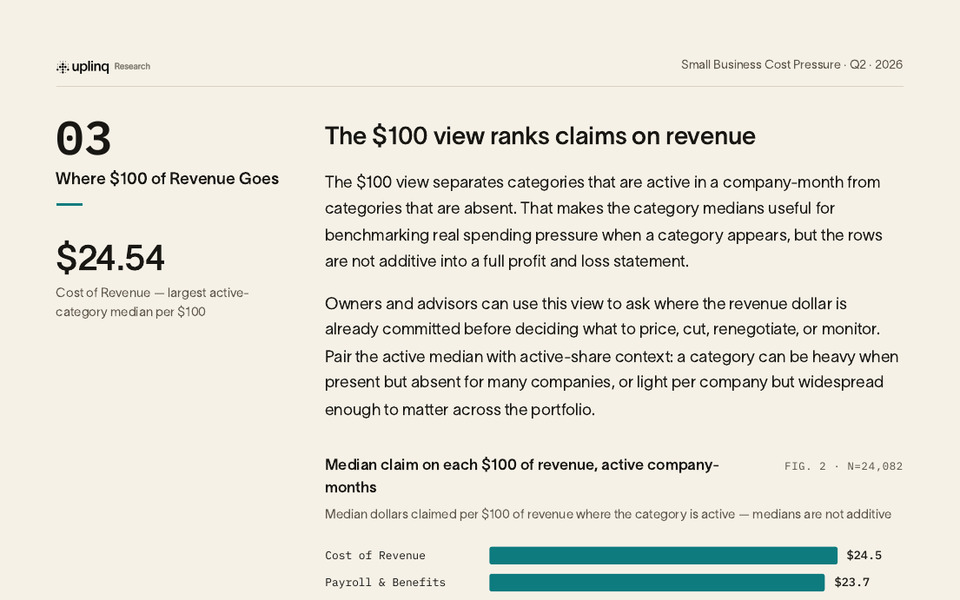
Active-category medians showing the largest claims on each $100 of revenue.
P. 06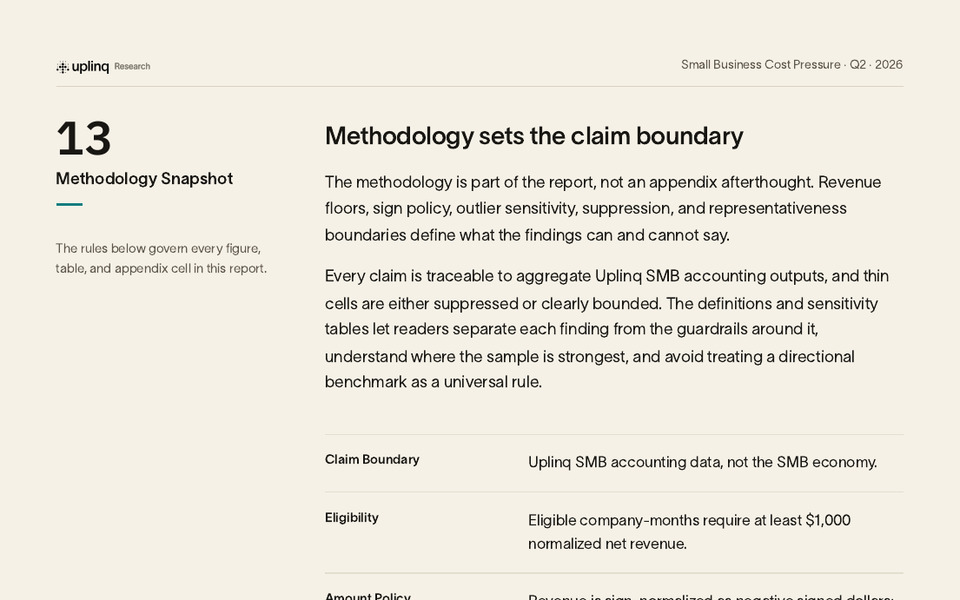
Claim boundary, eligibility, amount policy, and public-cell suppression rules.
P. 17Where $100 of revenue goes, line by line
Which costs are sticky, and which flex when revenue dips
Which categories outpaced matched-panel revenue
How report cost differs by revenue band and broad segment
The questions to bring to your advisor this quarter
How the benchmark is built, suppressed and bounded
The report includes the full rule set. The short version:
Aggregate Uplinq SMB accounting data; no record-level customer data is shown on the public page.
Eligible company-months require at least $1,000 normalized net revenue.
The aggregate source snapshot runs from July 2024 through June 2026. The public Cost Pressure Index ends with the latest complete month used for the series, May 2026.
Medians, aggregate shares, and index readings over anonymized cohorts.
Public chart cells suppress below 30 companies and prefer at least 50 companies.
The report covers 24,082 eligible company-months, 1,544 companies, and 6,017,910 included journal lines.
Uplinq SMB accounting data, not the full SMB economy.
Winsorization sensitivity does not move the median operating expense ratio; it mainly changes the high tail and mean.
Submit your email once to unlock the approved PDF and receive a backup link.
Pull your own operating-cost share for the last 12 months and set it next to the benchmark. If you're above the median, start with the sticky lines - they only move with lead time.
Bring the category cut to the next quarterly conversation. The useful question is which lines outgrew revenue, and which were structural.
Benchmarks like this are only usable against books that are current. That's the product.
See how Uplinq keeps books current